The Problem
BranchCache relies on hashes, think of these hashes as BranchCache’s way of saying, “Here’s what this content looks like -go ahead and trade it amongst yourselves!” Without hashes, clients are left clueless and default to downloading content directly from the source. We don't like that, do we?
It's up to the host serving the content to generate the hashes. In the world of ConfigMgr this translates to your BranchCache-enabled distribution points (DPs). The DP must create temporary (.tmp) files, calculate hashes, and then store them neatly in the BranchCache directory. Sounds simple, right? Not so fast.
Things can go wrong - security software locking .tmp files, the backend design of BranchCache causing .tmp filename conflicts, or a DP getting slammed by a mass deployment. All these examples can result in hash generation breaking. And without those hashes, BranchCache’s peer-to-peer magic falls apart. Let’s dive into some of the causes we’ve identified and solutions to keep your DPs humming along and allowing clients to peer the contentt.
Common Causes
- Security Software Interference
- Security software installed on DPs decides .tmp -files (which are crucial for hash generation) are suspicious and locks them. Nice move. Totally the opposite of what we need. Off to a great start!
- BranchCache Design Quirks
- In addition to antivirus locking, conflicts caused by duplicate file names can disrupt hashing. BranchCache lacks robust error handling for such scenarios, causing the entire process to fail.
- Performance Bottlenecks
- High load on the DP during mass deployments (hello, Patch Tuesday) can prevent the system from generating content hashes effectively.
Identifying the Issue
Clues you're in trouble
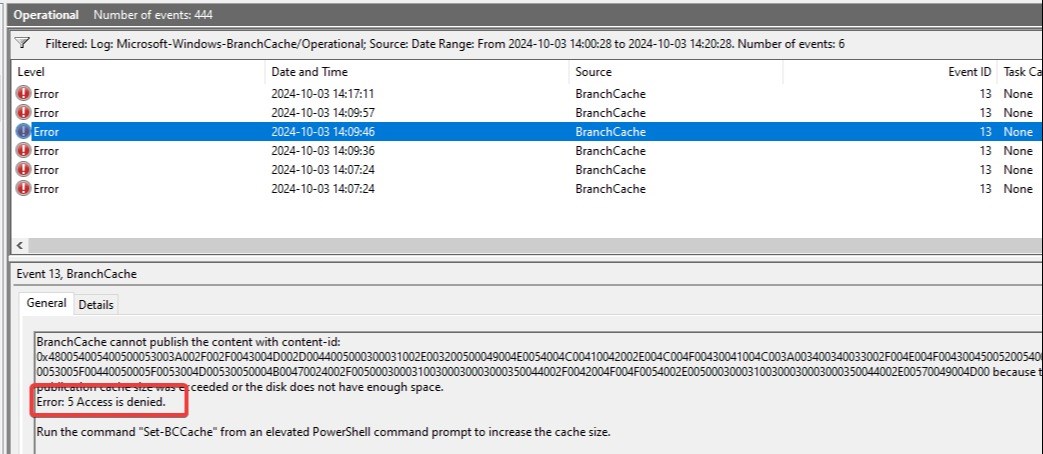
- Event ID 13 in the BranchCache Operational log with the specific message: "Error: 5 Access is denied."
- Note: Not all Event ID 13 entries mean trouble. Only investigate those with "Access is denied" in the message. (Yes, Microsoft reused the same Event ID for multiple issues. Good job 😉)

- Temporary Files Look for .tmp files left in the BranchCache directory.
- No Peering Activity Clients fail to share content via BranchCache for specific deployments.
Troubleshooting
You may now be saying to yourself, well this doesn’t sound good!? How can I monitor and fix this?
If you're seeing these symptoms, don't panic! The good news is that with a little proactive monitoring, you can identify issues early and keep things running smoothly. Here's how to keep track of your BranchCache health and ensure your hash generation is optimized for better performance.
Manual Troubleshooting: The Fun Begins
Step 1: Start hunting for stuck .tmp files
Run this PowerShell command to track them down:
Get-ChildItem -Path (Get-BCHashCache).CacheFileDirectoryPath -Filter *.tmp -Recurse
Spotting a .tmp file now and then? No biggie, it’s just BranchCache doing its thing. But if those .tmp files are starting to look like squatters, it’s time to move on to Step 2.
Step 2: Clear BranchCache
Flush BranchCache on the DP with:
Clear-BCCache -Force
This resets BranchCache, and will force hashes to be regenerated when content is requested from your clients.
Wow, good job, you! Time to relax, right? Not so fast. If performance issues or antivirus locks are your real culprits, this is just a temporary fix, and hash generation will probably crash and burn again, sooner than you think.
Step 3: Monitor DP Performance
Are performance bottlenecks choking your DPs and preventing your hashes from generating? Set up counters to catch the culprits:
$LogmanBinFolder = "C:\PerfLogs\BC-DP-troubleshooting"
logman.exe create counter BC-Perf-Counter-Log -f bin -v mmddhhmm -max 4096 -c "\Memory\Available MBytes" "\Memory\% Committed Bytes In Use" "\Memory\Pages/sec" "\Network Interface(*)\Packets/sec" "\PhysicalDisk(_Total)\Disk Reads/sec" "\PhysicalDisk(_Total)\Disk Writes/sec" "\Processor Information(_Total)\% Processor Time" "\BranchCache Kernel Mode\Total HTTP Requests" -si 00:00:01 -o "$LogmanBinFolder\BC-Perf-Counter-Log"
Look for:
- CPU spikes
- Disk I/O bottlenecks
- Low memory availability
Hate manual troubleshooting? Let us help you set up some automated monitoring
For the lazy (or, as we prefer to say, efficiency enthusiasts), grab this script at Github. This bad boy does the heavy lifting for you: it automatically sets up the necessary performance counters, keeps a watchful eye on the BranchCache event log for that specific Event ID 13 error, and logs everything.
Here’s where it gets clever, it’ll stop the performance counters as soon as the specific event is detected (or after timing out), match up the timestamps of heavy resource usage with those pesky Event ID 13 errors, and make identifying your bottlenecks as simple as pie.
Oh, and this script? We make it publicly available since it makes sense no matter if you're a customer of ours or not.
Pro tip: Fire up the script before your big deployments, especially if you’ve noticed a trend of your BranchCache P2P efficiency taking a nosedive during these. Why? Because the script isn’t psychic, it needs data to do its thing.
Fixes that Actually Work
- Split Up Your DPs
Keep your MCC-enabled DPs on dedicated boxes. Mixing these with DPs holding general ConfigMgr content like packages and apps could be a recipe for BranchCache hash generation chaos. - Adjust Antivirus Settings
Tell your antivirus not to touch .tmp files in your BranchCache directories. - Use Deployment Rings
Implement deployment rings to evenly distribute the load. Ensure clients in the first ring are spread across your boundary groups, with the goal of giving each of your DPs time to generate hashes before a large number of clients start requesting the content. This ensures you're well-prepared with freshly baked hashes when the big crowd comes knocking. Are you using StifleR? Enjoy your afternoon looking at green graphs showing you excellent peering. - Monitor the performance of your DPs with our script
If you've used our script and noticed a correlation between Event ID 13 and high CPU, memory, or disk utilization, it’s time to beef up your DP. If the hardware is walking on its knees during deployments, give it some extra juice, more resources will help ensure smoother performance and prevent those dreaded bottlenecks.
Bonus: Deciphering Event ID 13 Content
Ok, I’ve been rambling on about Event ID 13 for ages now and had you waste hours staring at those events. What the HEX does it actually mean?
Right, the message in those events are about as readable as ancient hieroglyphics.
Turn it into something useful with this script:
$message = 'Access is denied'
$id = 13

$AllEntries = Get-WinEvent -FilterHashtable @{Logname='Microsoft-Windows-BranchCache/Operational';id=$id} -ErrorAction SilentlyContinue | Where-Object {($_.Message.Contains($message))}


If (!$AllEntries){
    Write-Host "No BranchCache Event ID 13 found"
}
Else {
    [System.Collections.ArrayList]$EventInfo = @()
    Foreach ($evt in $AllEntries){
      $event = [xml]$evt.ToXml()
      $url = $event.Event.UserData.PublishFailedEvent.ContentId
      #create the URL from the hex content ID
      $id = -join (
        $url | Select-String ".." -AllMatches |
            ForEach-Object Matches |

                ForEach-Object {
                If ([string]$_ -eq "00") {}
                Else{[char]+"0x$_"}
                }
                   )
      $ErrorMSG = $event.Event.UserData.PublishFailedEvent.ErrorMessage
      $ErrorCode = $event.Event.UserData.PublishFailedEvent.ErrorCode

            $obj = [PSCustomObject]@{

                    # Add values to arraylist
                    TimeStamp = $evt.TimeCreated
                    FileUrl = "$id"
                    ErrorMessage = "$ErrorMSG"
                    ErrorCode = "$ErrorCode"

                }

        # Add all the values
                $EventInfo.Add($obj)|Out-Null

    }

    $EventInfo | Out-GridView
}
It should give you a gridview similar to this:

Now you can finally satisfy your curious mind.


